A while back I wrote a post on how to install and configure Analytics Plus from ManageEngine and how to get data from the System Center Configuration Manager database to create reports and dashboards.
In this post I will share with you SQL queries that might come in handy when you are about to hand in reports or when you are creating your own dashboards for monitoring.
If you haven’t already installed Analytics Plus, click HERE to get started.
Note: When copying the SQL-Query to Analytics Plus, make sure to use the button to copy to clipboard or show the source. Otherwise the formatting might be corrupted.
Content Distribution Status
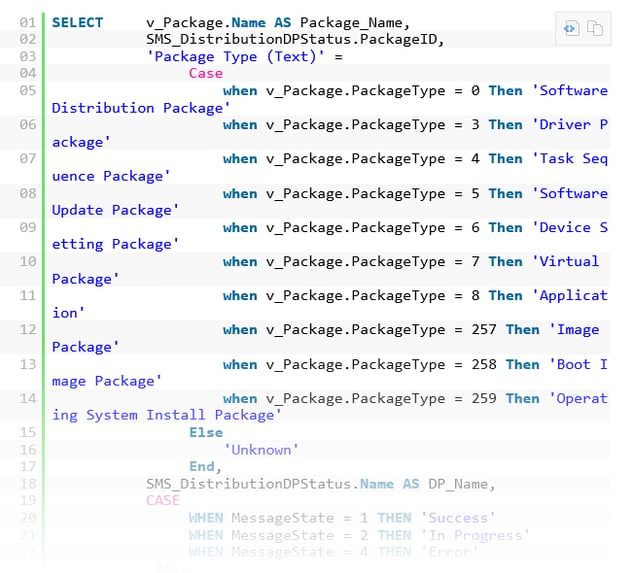
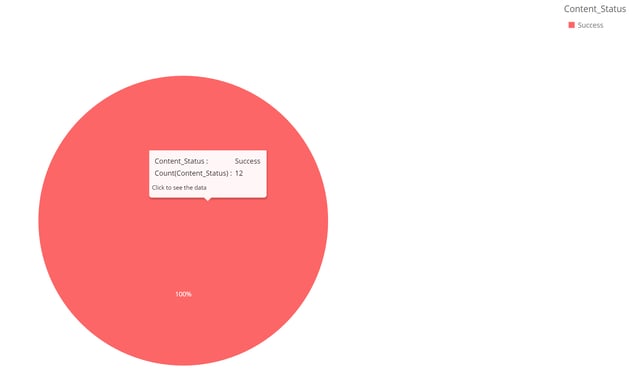
Based on the data gathered with this query, the report will show you the status of your distribution points. I prefer to use a “pie chart” for this one since there are three major categories;
- Success
- In Progress
- Failed
Query: [Download query]

When used in a pie chart, the result will be similar to this:

Computers missing patches
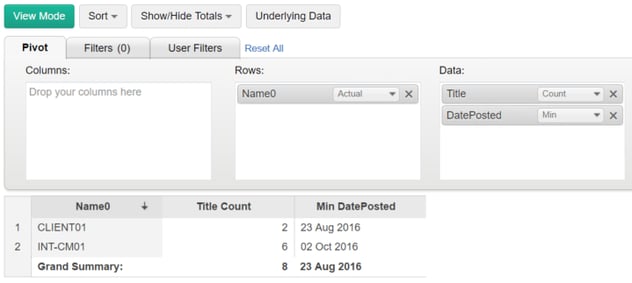
Another report that is useful at least once a month is a list of computers that are missing patches. There will always be computers that are missing a few patches, so based on the data from this query, we will create a “Pivot View” to see the name of the computer and the number of missing patches.
Query: [Download query]

From this query I select the following columns:
- Name0 (Name of client)
- ArticleID (KB-number)
- Title
- DatePosted (Date when released)
The created Pivot View will look similar to the one here, depending on your data of course, but you see the name of the client, number of missing patches and the date of the oldest patch that isn’t deployed.

